asamir/laravel-in-db-performance-monitor
Composer 安装命令:
composer require asamir/laravel-in-db-performance-monitor
包简介
Monitor your laravel application performance by logging requests in your database then analyze it. The log includes request parameters, actions, SQL queries and errors beside that you can know the requests with raw SQL queries.
关键字:
README 文档
README
Monitor your laravel application performance by logging requests in your database then analyze it. The log includes request parameters, actions, SQL queries and errors beside that you can know the requests with raw SQL queries. Demo
Table of contents
- Requirements
- Installation
- Documentation
- Best Practices
- New Features and Upgrade
- Generate Dummy Requests
- Author
Requirements
Laravel >=5.1
Installation
1- Run composer require asamir/laravel-in-db-performance-monitor
2- For laravel < 5.5 add this provider in config/app.php
'providers' => [
	\\...
	ASamir\InDbPerformanceMonitor\InDbPerformanceMonitorProvider::class,
]
3- Run php artisan in-db-performance-monitor:init
4- Add and configure the inDbMonitorConn connection in config/database.php file => Hint: the package .env variables is created for you by the previous command:
'connections' => [
    //...
    'inDbMonitorConn' => [
        'driver' => 'mysql',
        'host' => env('IN_DB_MONITOR_DB_HOST', ''),
        'port' => env('IN_DB_MONITOR_DB_PORT', '3306'),
        'database' => env('IN_DB_MONITOR_DB_DB', ''),
        'username' => env('IN_DB_MONITOR_DB_USERNAME', ''),
        'password' => env('IN_DB_MONITOR_DB_PASSWORD', ''),
        'charset' => 'utf8',
        'collation' => 'utf8_unicode_ci',
        'prefix' => 'asamir_',
        'strict' => false,
        'engine' => null,
    ],
]
5- Add the this middleware in app/Http/Kernel.php file
protected $middleware = [
    //...
    \ASamir\InDbPerformanceMonitor\InDbPerformanceMonitorMiddleware::class
];
6- Add this line in app/Exceptions/Handler.php => public function report(Exception $exception)
public function report(Exception $exception) {
    //...
    \ASamir\InDbPerformanceMonitor\LogErrors::inDbLogError($exception);

    parent::report($exception);
}
//..Hint For laravel < 5.3 => instead of $exception it will be $e
7- Run php artisan migrate
Now you can make requests and monitor it at /admin-monitor
Remember to open config/inDbPerformanceMonitor.php to set your custom configurations
Documentation
Configurations
-
The inDbMonitorConn connection is where the requests logs will be set, so it can be isolated in another database away from the application database or you can set it in the same database no problem.
-
The package creates inDbPerformanceMonitor.php file in your config folder which has options
-
IN_DB_MONITOR_WORK => If true the package will work and log the comming requests (default = true)
-
IN_DB_MONITOR_PANEL => If false the admin panel will not be accessible and any link to '/admin-monitor/*' with throw 404 (default = true)
-
IN_DB_MONITOR_TOKEN => Holds the admin-monitor passowrd token (default password = monitor)
-
IN_DB_MONITOR_NEGLICT_START_WITH => Array of routes to neglict from log (e.x. /test so any request start with /test will not be logged in the DB)
-
IN_DB_MONITOR_NEGLICT_REQUEST_DATA => If true request data will not be logged and will be replaced with ['%__ALL_HIDDEN__%'] (default = false)
-
IN_DB_MONITOR_NEGLICT_PARAMS_CONTAIN => Fields in the request which contain any of these names will not be logged and it will be replaced with %_HIDDEN_%
-
IN_DB_MONITOR_NEGLICT_SESSION_DATA => If true session data will not be logged and will be replaced with ['%__ALL_HIDDEN__%'] and will log the session id only (default = false)
-
IN_DB_MONITOR_LOG_PACKAGE_QUERIES => If true log queries made by the package in your laravel log (default = false)
-
IN_DB_MONITOR_GET_IP_INFO => If true get IP location data (default = true)
-
IN_DB_MONITOR_GET_IP_CLASS => You can change it and use your own class with new third party web services to get the IP location.
-
-
Hint: You will find the package env variables created in your .env file
Routes
- /admin-monitor => The login page (default password = monitor).
- /admin-monitor/dashboard => Dashboard with requests counts.
- /admin-monitor/requests => List all requests and provided with search panel to filter the results.
- /admin-monitor/request/{id} => Display request details.
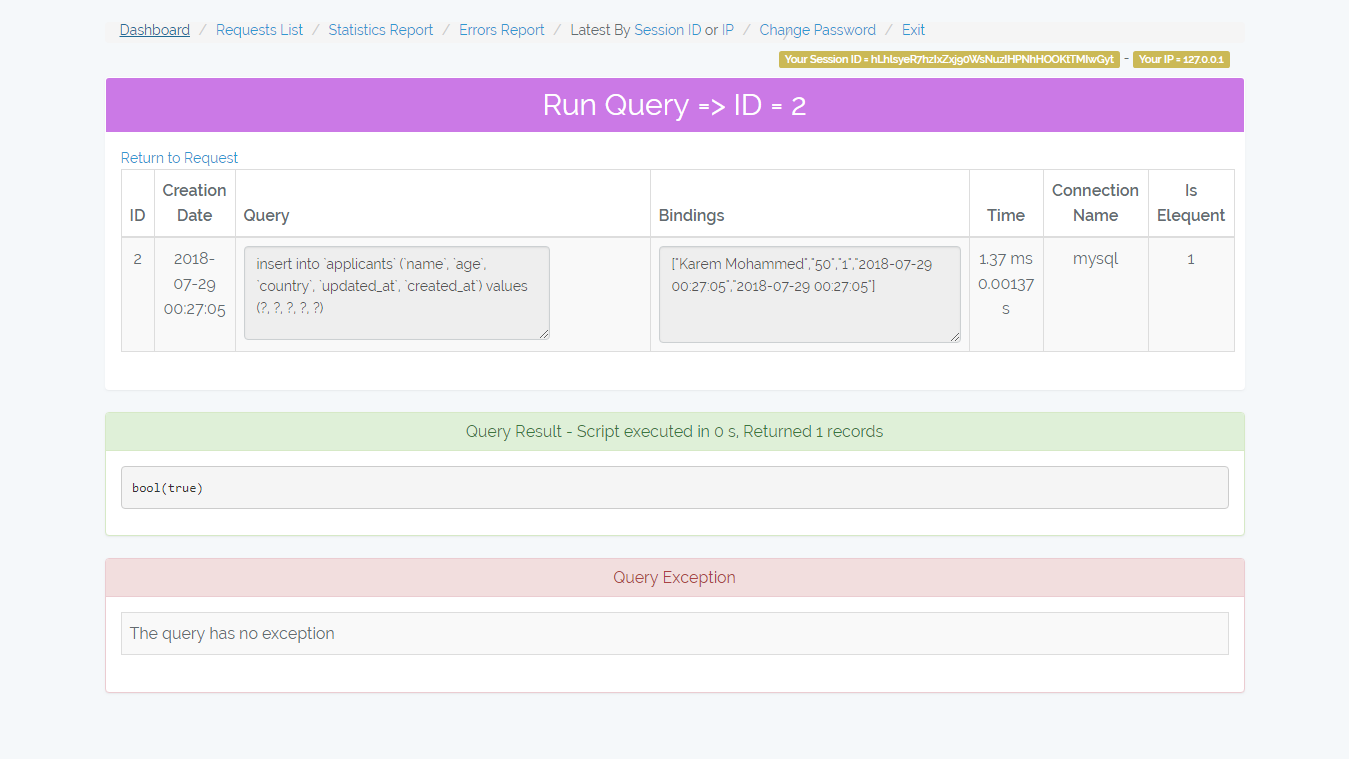
- /admin-monitor/run-query/{id} => Display query details and re-run it.
- /admin-monitor/statistics-report => Statistics report of requests performance group by request route uri and type.
- /admin-monitor/errors-report => Statistics report of requests errors group by page uri, type, and error message.
- /admin-monitor/archives-report => Statistics report of requests archives.
- /admin-monitor/ips-report => Statistics report of requests IPs Info.. Also you have the ability to recalculate the uncompleted IPs Info.
- /admin-monitor/change-password => Change the password of the admin monitor panel.
- /admin-monitor/logout => Logout from the admin monitor panel.
Demo screen shots
Hint: in the search boxes you can use the like wildcards like %%
/admin-monitor
The login page (default password = monitor)

/admin-monitor/dashboard
Dashboard with requests counts grouped by type and archive tag.

/admin-monitor/requests
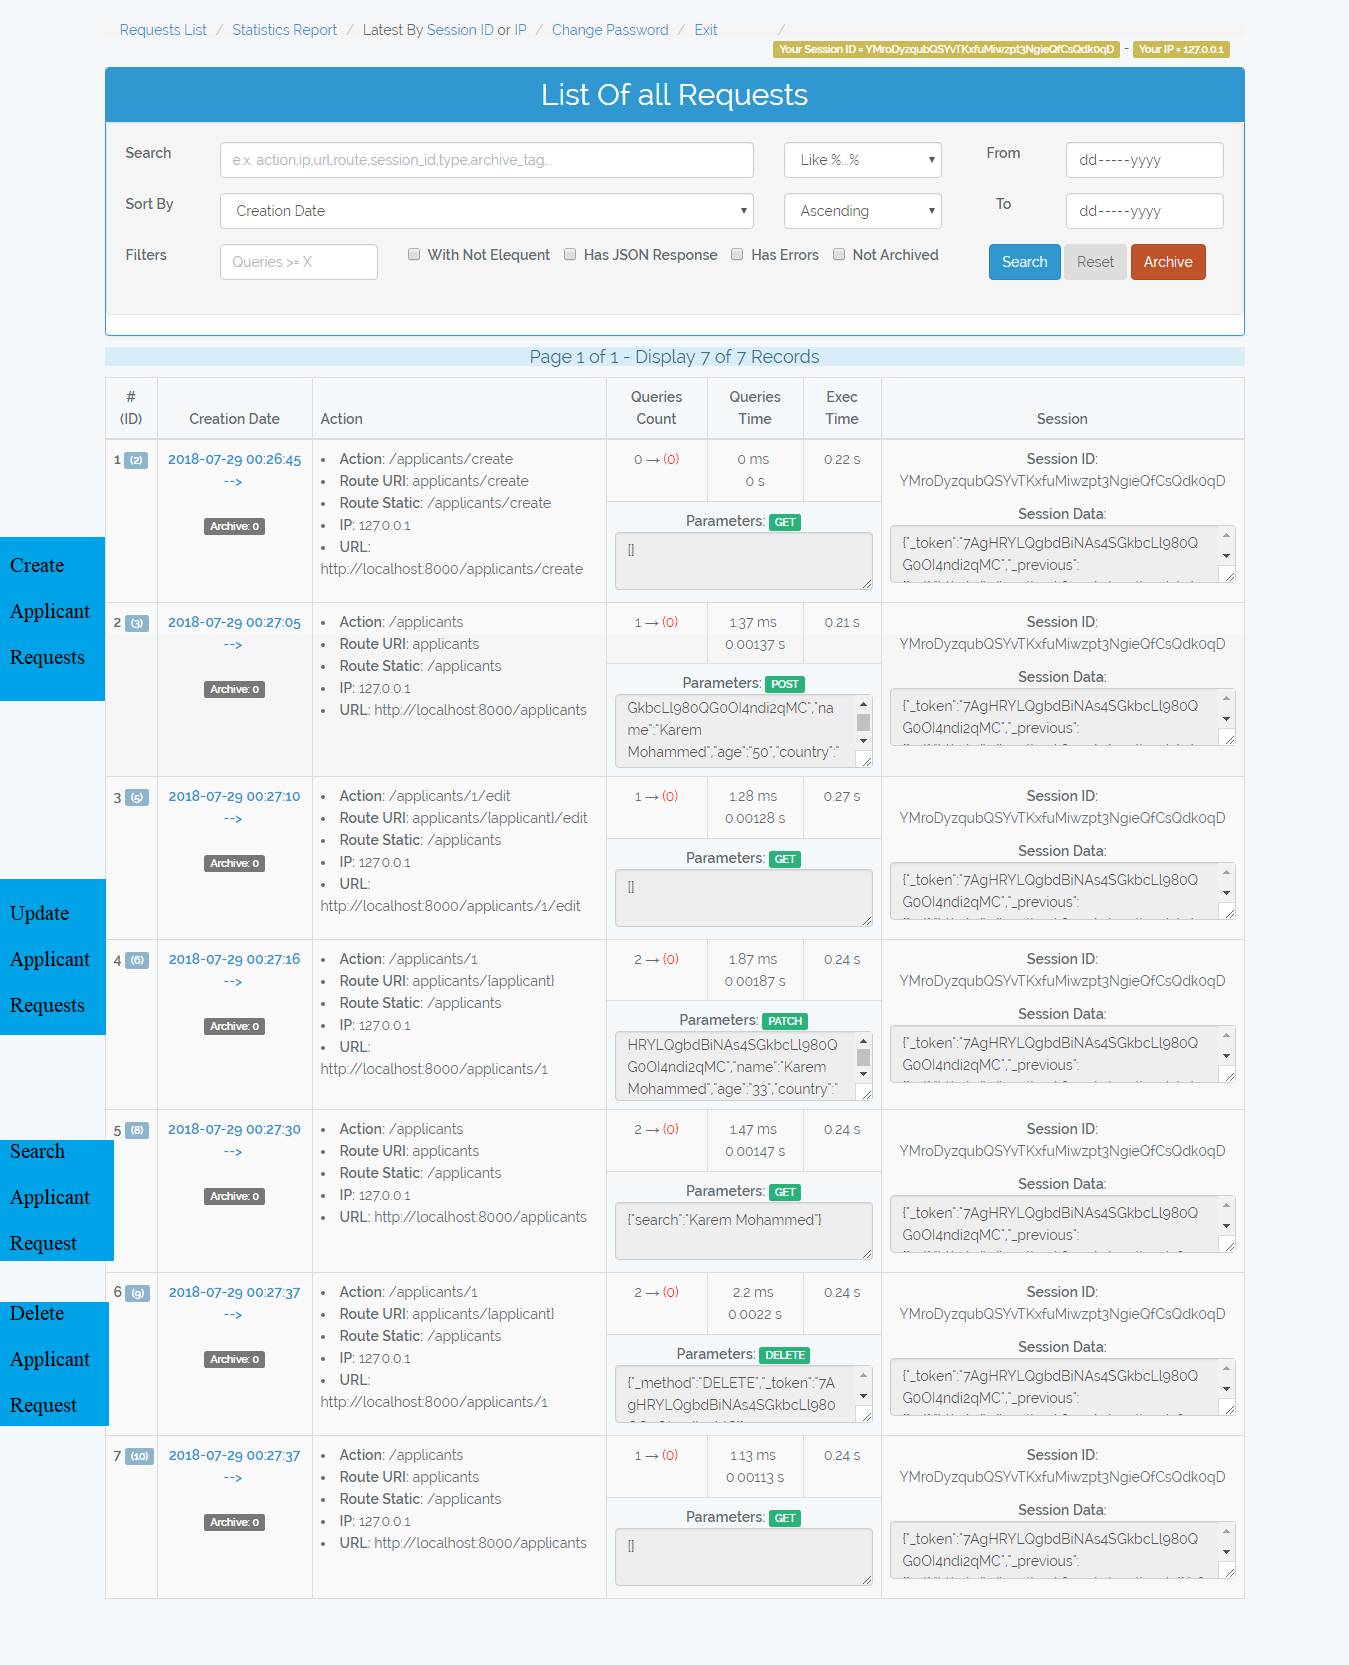
List all logged requests
-
Search box: search in (Action, Route, URL, Session ID, Type[POST,GET,...], Archive Tag) and in (Error Message, Error File) in case of checked Has errors check box
-
Not Elequent: I mean free queries like
\DB::select(\DB::raw('select * from applicants where id = 10'));this queries are vulnerable to SQL injection attacks. The number in red color represents the number of free queries in the request. -
Archive button: Give tag => date('YmdHis') to requests with archive tag = 0
-
In the table you will find number of queries, queries total time, and request execution time.
-
You can filter by creation date from => to
-
If you hovered the Error label, it will display the error message, file, and line number.
-
The scenario of the requests in the image below
- Create applicant
- Edit Applicant
- Search Applicant
- Delete Applicant
-
The scenario of the requests in the image below
- Archive old requests so the appear with tag 20180729010530 and the others with tag 0 => So we can filter them
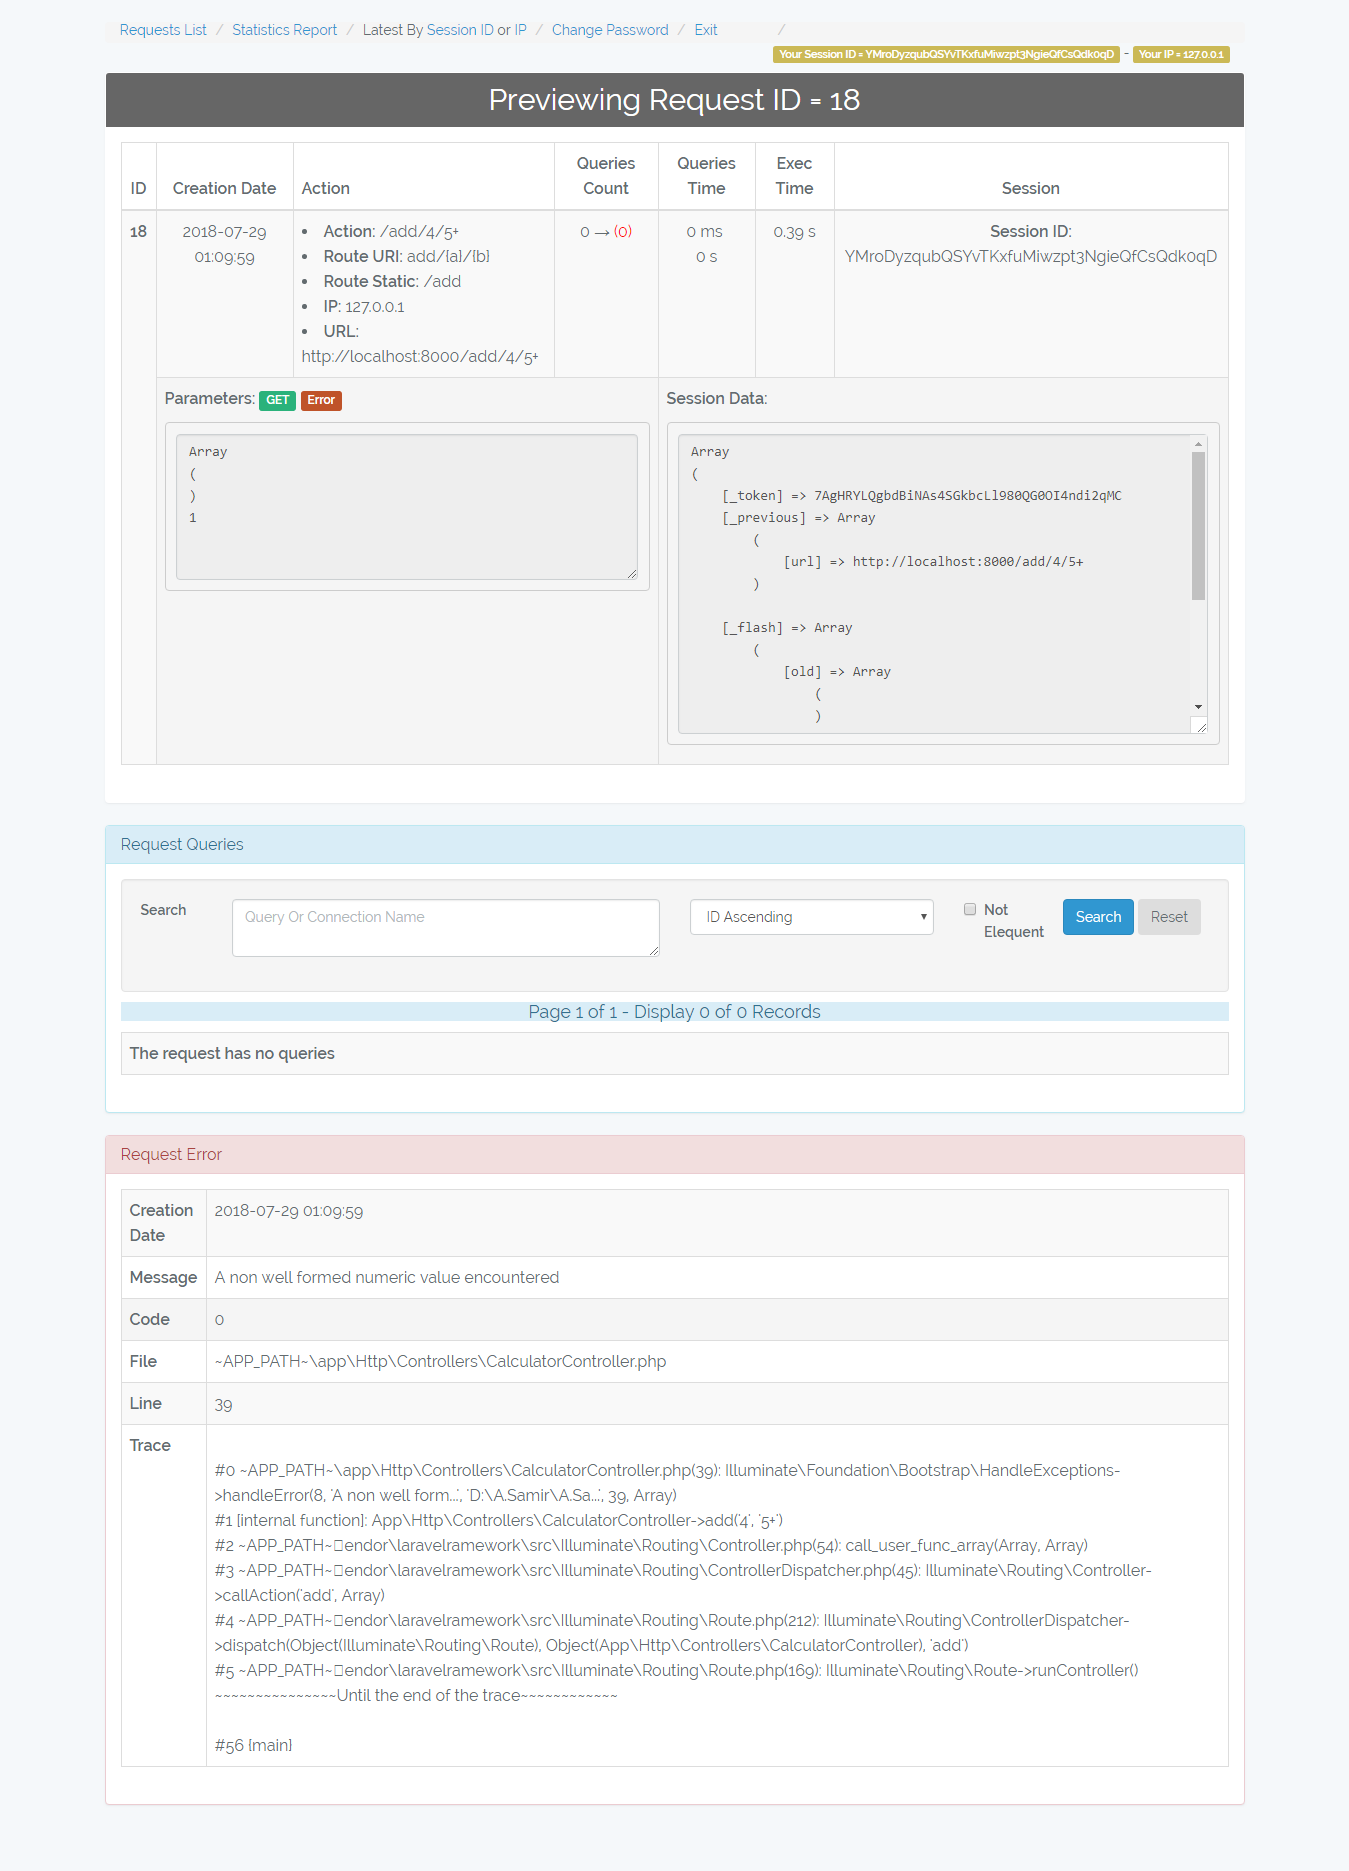
- Make request to /add/{a}/{b} which adds two integers. I passed to it 4 and 5+, so it throwed exception because 5+ is not integer.
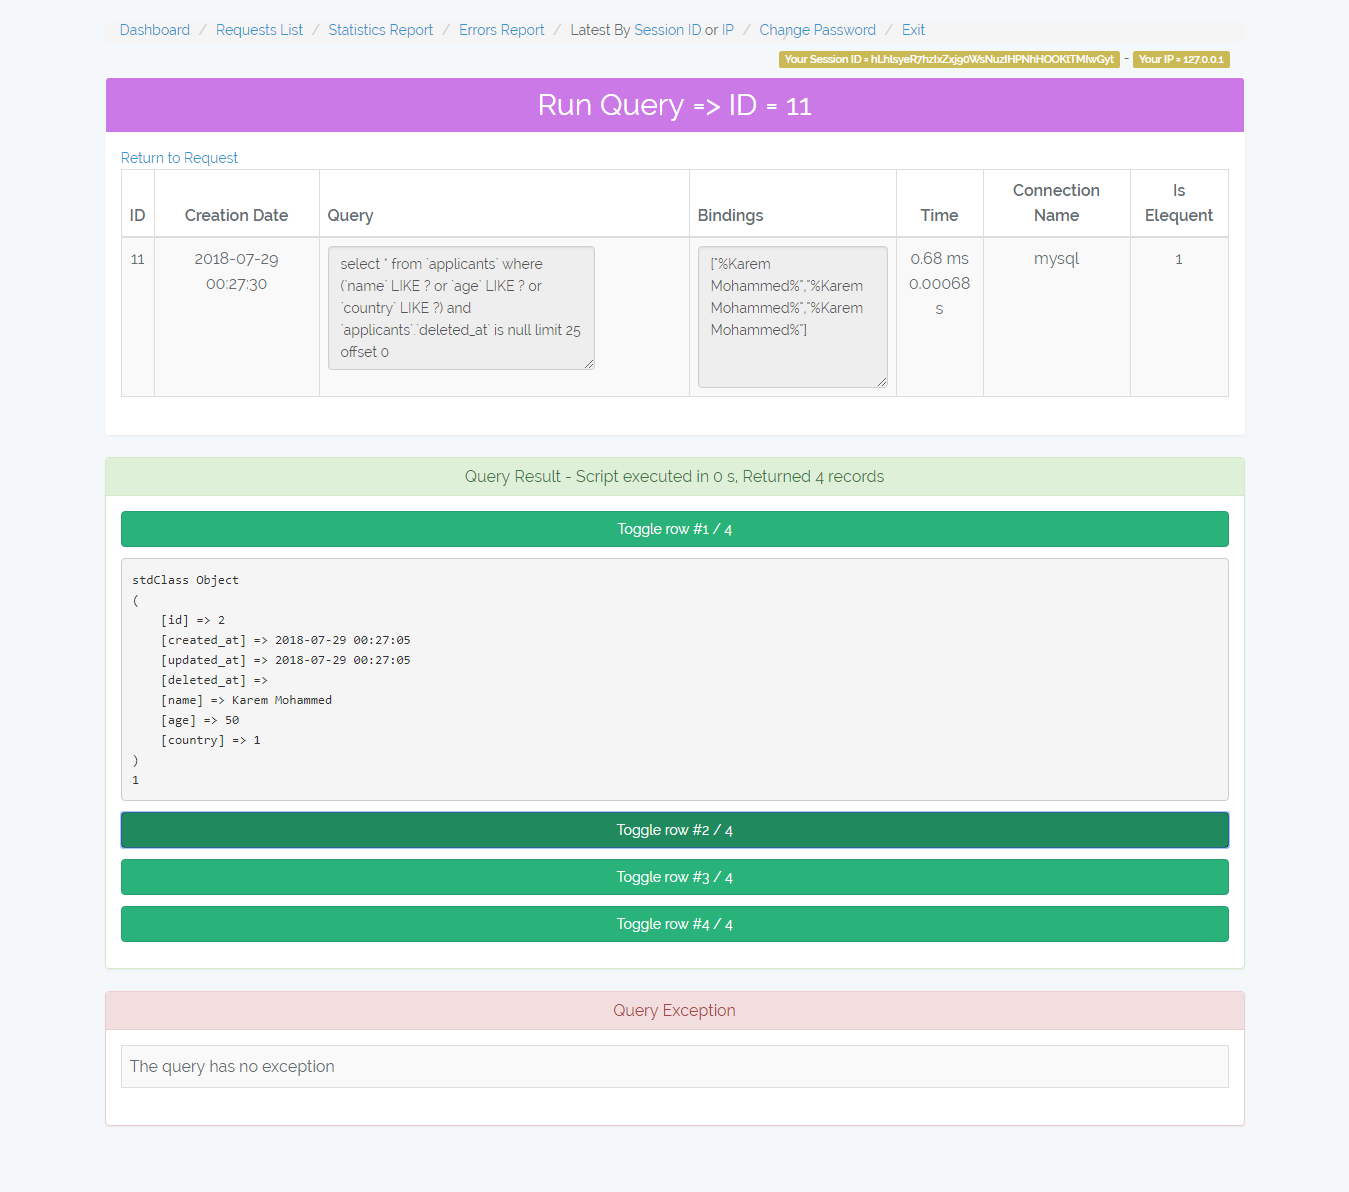
- Make request to /api/applicants which returns json response. Hint: I used a free query
\DB::select(\DB::raw('select * from applicants'));to retreive applicants, also notice that the request session id changed because it is not under the web middleware.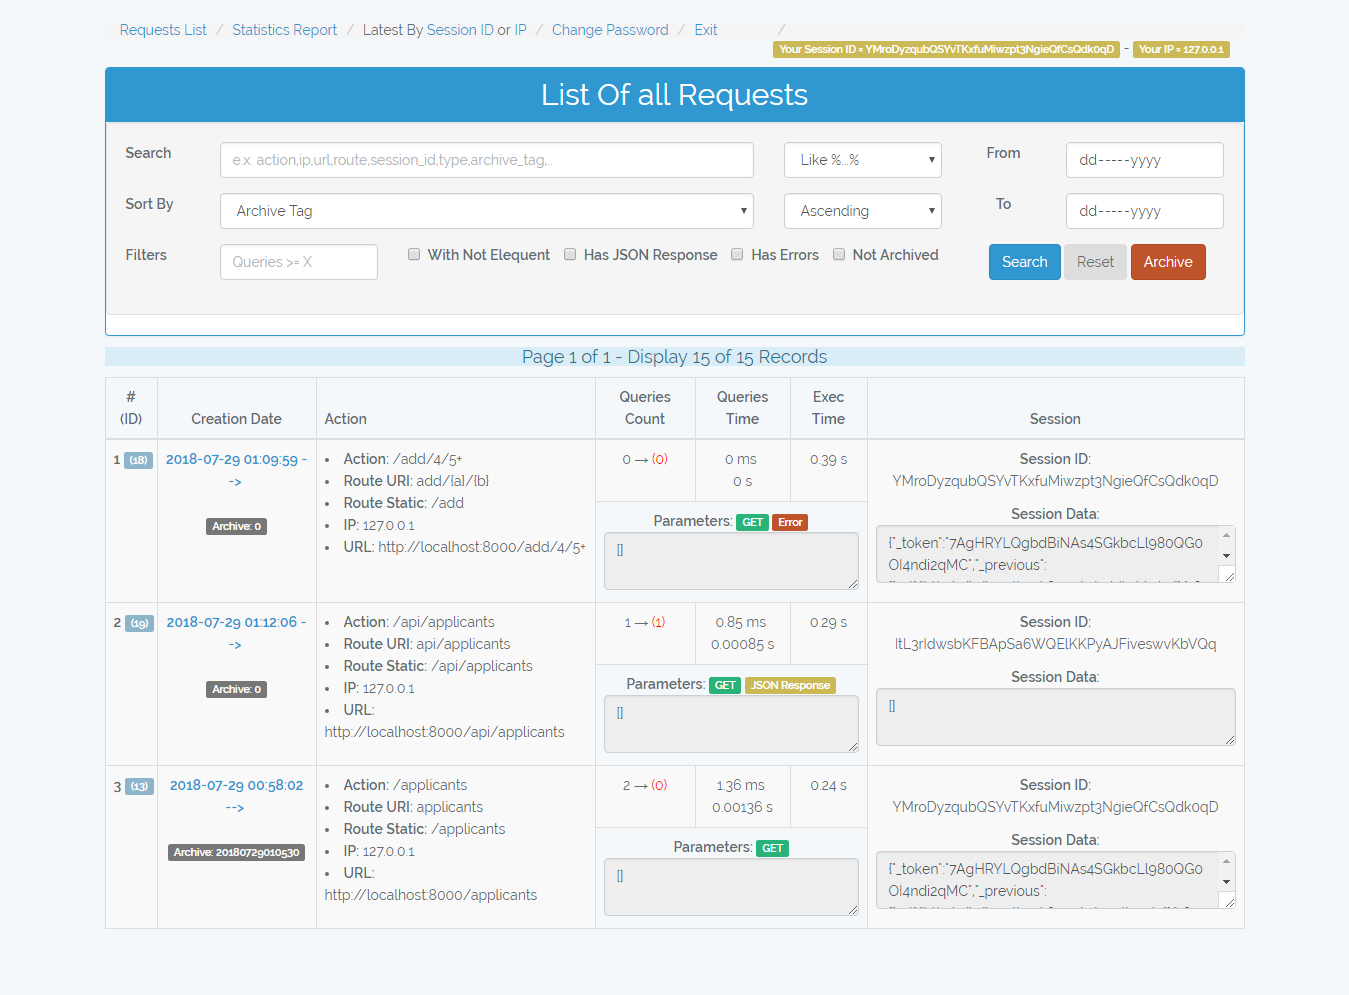


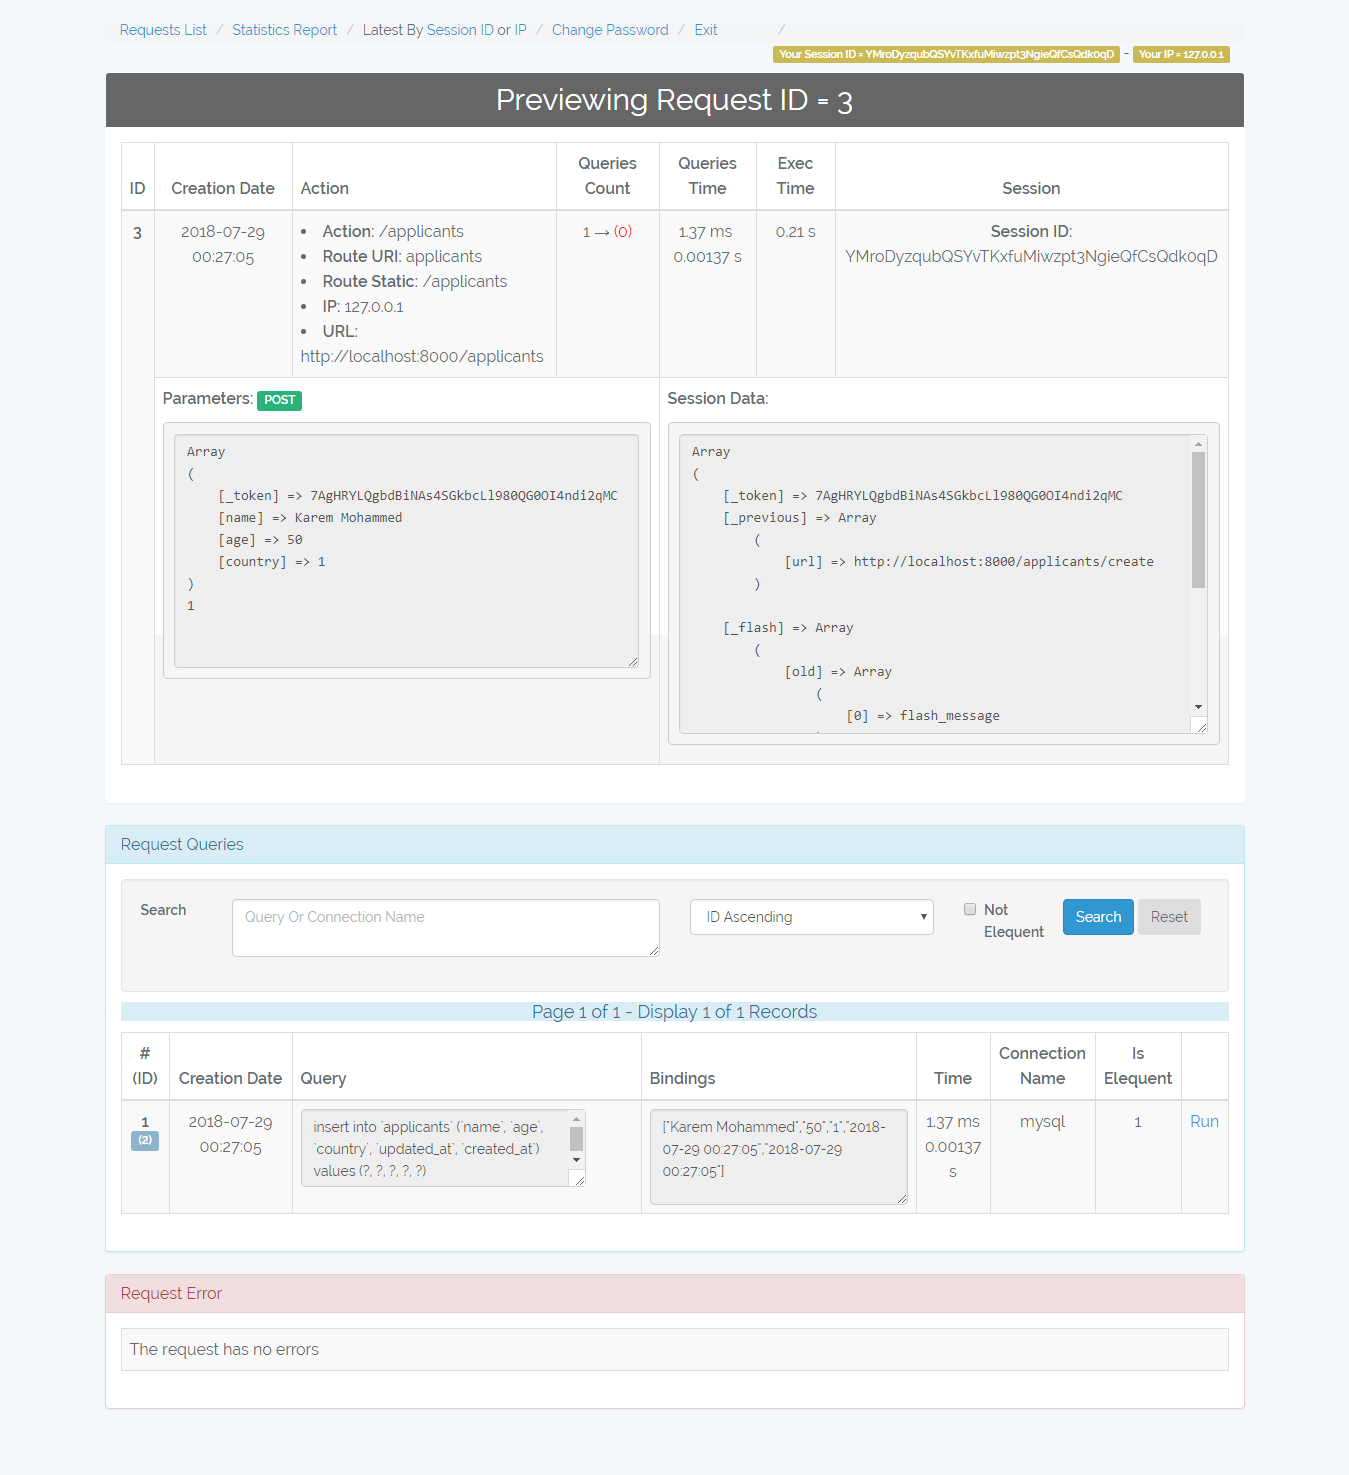
/admin-monitor/request/{id}
Shows the request details, queries, and error beside that it allows you to re-run the queries.
Hint => You can quickly get your last request by Latest By Session ID Or IP

By Session ID => Get last request made by your session id

By IP => Get last request made by your ip (requests made by api or routes
which don't use the web middleware will generate different session id at
every request, so you can get them by your IP).
-
Request of create applicant
 ...
...
-
Request of search applicants
 ...
...
-
Request of error add/4/5+


/admin-monitor/statistics-report
Statistics report about the requests performance group by request route uri and type.

/admin-monitor/errors-report
Statistics report of requests errors group by page uri, type, and error message.

/admin-monitor/archives-report
Statistics report of requests archives.

/admin-monitor/ips-report
Statistics report of requests IPs. Also you have the ability to recalculate the uncompleted IPs Info.

/admin-monitor/change-password
To change admin monitor panel password.

Best Practices
I was working on a project and my task was to test the application performance and list the requests with performance issues. The problem was that after migrating the data and the database size became larger the application performance decreased and sometimes crashes. Instead of loop on all the application code and check every line on it, I built a listener to log the requests data (queries) run by the application then I analyzed this data and quickly found the requests with weak points. As a result of this, I built the laravel-in-db-performance-monitor package and published it to be used by anyone.
Here are some tips for best practices:
- Put the log tables in a separated database, because it's size increase rapidly.
- Switch the logger on:
- In the development and testing stages to analyze the performance of your requests and check your queries.
- In the production for a small period (e.x. first week) to monitor the application performance and understand your users behaviors. After that switch it off (Set IN_DB_MONITOR_WORK=false).
- In case of any issue to debug the request queries and error.
- Remember to set (IN_DB_MONITOR_PANEL=false) when your application is online, so the /admin-monitor links will not be accessible and set it to true when you want to debug something or review the reports.
- Set your custom configurations in the config/inDbPerformanceMonitor.php file specially the IN_DB_MONITOR_NEGLICT_START_WITH and IN_DB_MONITOR_NEGLICT_PARAMS_CONTAIN parameters.
- Use the "Latest By Session ID or IP" to get your last request quickly without searching.
- Change the password to a complex one.
- Use the "Statistics Report" to detect the requests which have performance issues by max queries count, max queries time, max execution time, non elequent queries count, and so on.
- Use the "Errors Report" to detect the most frequent exceptions happened in your system.
- Check the generated queries of the third party packages you use.
- Check the request which preview lists (e.x. list of customers) and make sure that you use pagination and loaded the relations correctly by using the laravel "with()" function.
- e.x. if model customer has relation with model orders, and model products and we will display 10 customers => (without "with()" laravel will generate 21 query - but by using "with()" it will be 4 queries only).
- Check the requests of your dashboards and reports and make sure that you use the sql aggregation functions correctly.
New Features and Upgrade
- Get the request country and location Info.
- Storing data as serialized string instead of encoded JSON.
- Add more reports and statistics.
- Enhance the UI and Fix Issues.
Hint: If you are using an older version (<v2) please run this command after upgrade
php artisan in-db-performance-monitor:init --ips=true --serialize=true
and add this lines in config/inDbPerformanceMonitor.php
'IN_DB_MONITOR_GET_IP_INFO' => env('IN_DB_MONITOR_GET_IP_INFO', true),
'IN_DB_MONITOR_GET_IP_CLASS' => '\\ASamir\\InDbPerformanceMonitor\\IPInfo',
Dummy Data => Demo (password=monitor)
Author
Ahmed Samir
Contacts: eng.ahmed.samir.fci@gmail.com | Linkedin
asamir/laravel-in-db-performance-monitor 适用场景与选型建议
asamir/laravel-in-db-performance-monitor 是一款 基于 HTML 开发的 Composer 扩展包,目前已累计 6.82k 次下载、GitHub Stars 达 21, 最近一次更新时间为 2018 年 07 月 30 日, 在 PHP 生态内属于活跃度较高的组件。
它主要适用于以下技术方向: 「performance」 「monitor」 「laravel」 「analysis」 「in db」 「performance analysis」 等业务场景。在实际项目中,围绕这些方向常见需要落地的问题包括:接口对接、性能调优、并发安全、与既有框架(Laravel / ThinkPHP / Yii / Webman 等)的兼容适配,以及生产环境的日志埋点与稳定性保障。
我们在过去多个企业项目中使用过 asamir/laravel-in-db-performance-monitor 或与其功能相近的方案,如果你在选型或落地过程中遇到问题,例如 版本兼容、二次改造、私有化封装、与内部系统对接、生产 BUG 排查,欢迎联系我们协助评估。
基于 asamir/laravel-in-db-performance-monitor 在你已有业务上做功能扩展、字段裁剪、UI 适配、与内部账号 / 权限 / 日志系统的深度对接。
线上偶发问题、内存泄漏、慢查询、并发异常等排查修复;针对高流量场景做缓存、队列、索引层面的调优。
承接完整的项目从需求 → 设计 → 开发 → 上线 → 长期运维;也可按月提供技术保姆服务。
与 asamir/laravel-in-db-performance-monitor 相关的其它包
同方向 / 同关键字的高下载量 PHP Composer 包推荐,方便对比选型:
g4 application profiler package
CSS/Javascript Minificator, Compressor and Concatenator for TYPO3 - highly configurable frontend asset optimization for CSS/JS merging, minification and compression with optional body parsing, async/defer loading, inline output, data-ignore exclusions, SRI integrity validation/calculation, external
Symfony bundle to monitor and execute commands
Collections of statsd collectors with templated metric names
WordPress mu-plugin to remove jQuery Migrate from the list of jQuery dependencies and to allow jQuery to enqueue before </body> instead of in the <head>.
A Laravel package to monitor queue jobs.
统计信息
- 总下载量: 6.82k
- 月度下载量: 0
- 日度下载量: 0
- 收藏数: 21
- 点击次数: 25
- 依赖项目数: 0
- 推荐数: 0
其他信息
- 授权协议: MIT
- 更新时间: 2018-07-30