attendlabs/filament-apex-charts
Composer 安装命令:
composer require attendlabs/filament-apex-charts
包简介
Apex Charts integration for Filament PHP.
README 文档
README
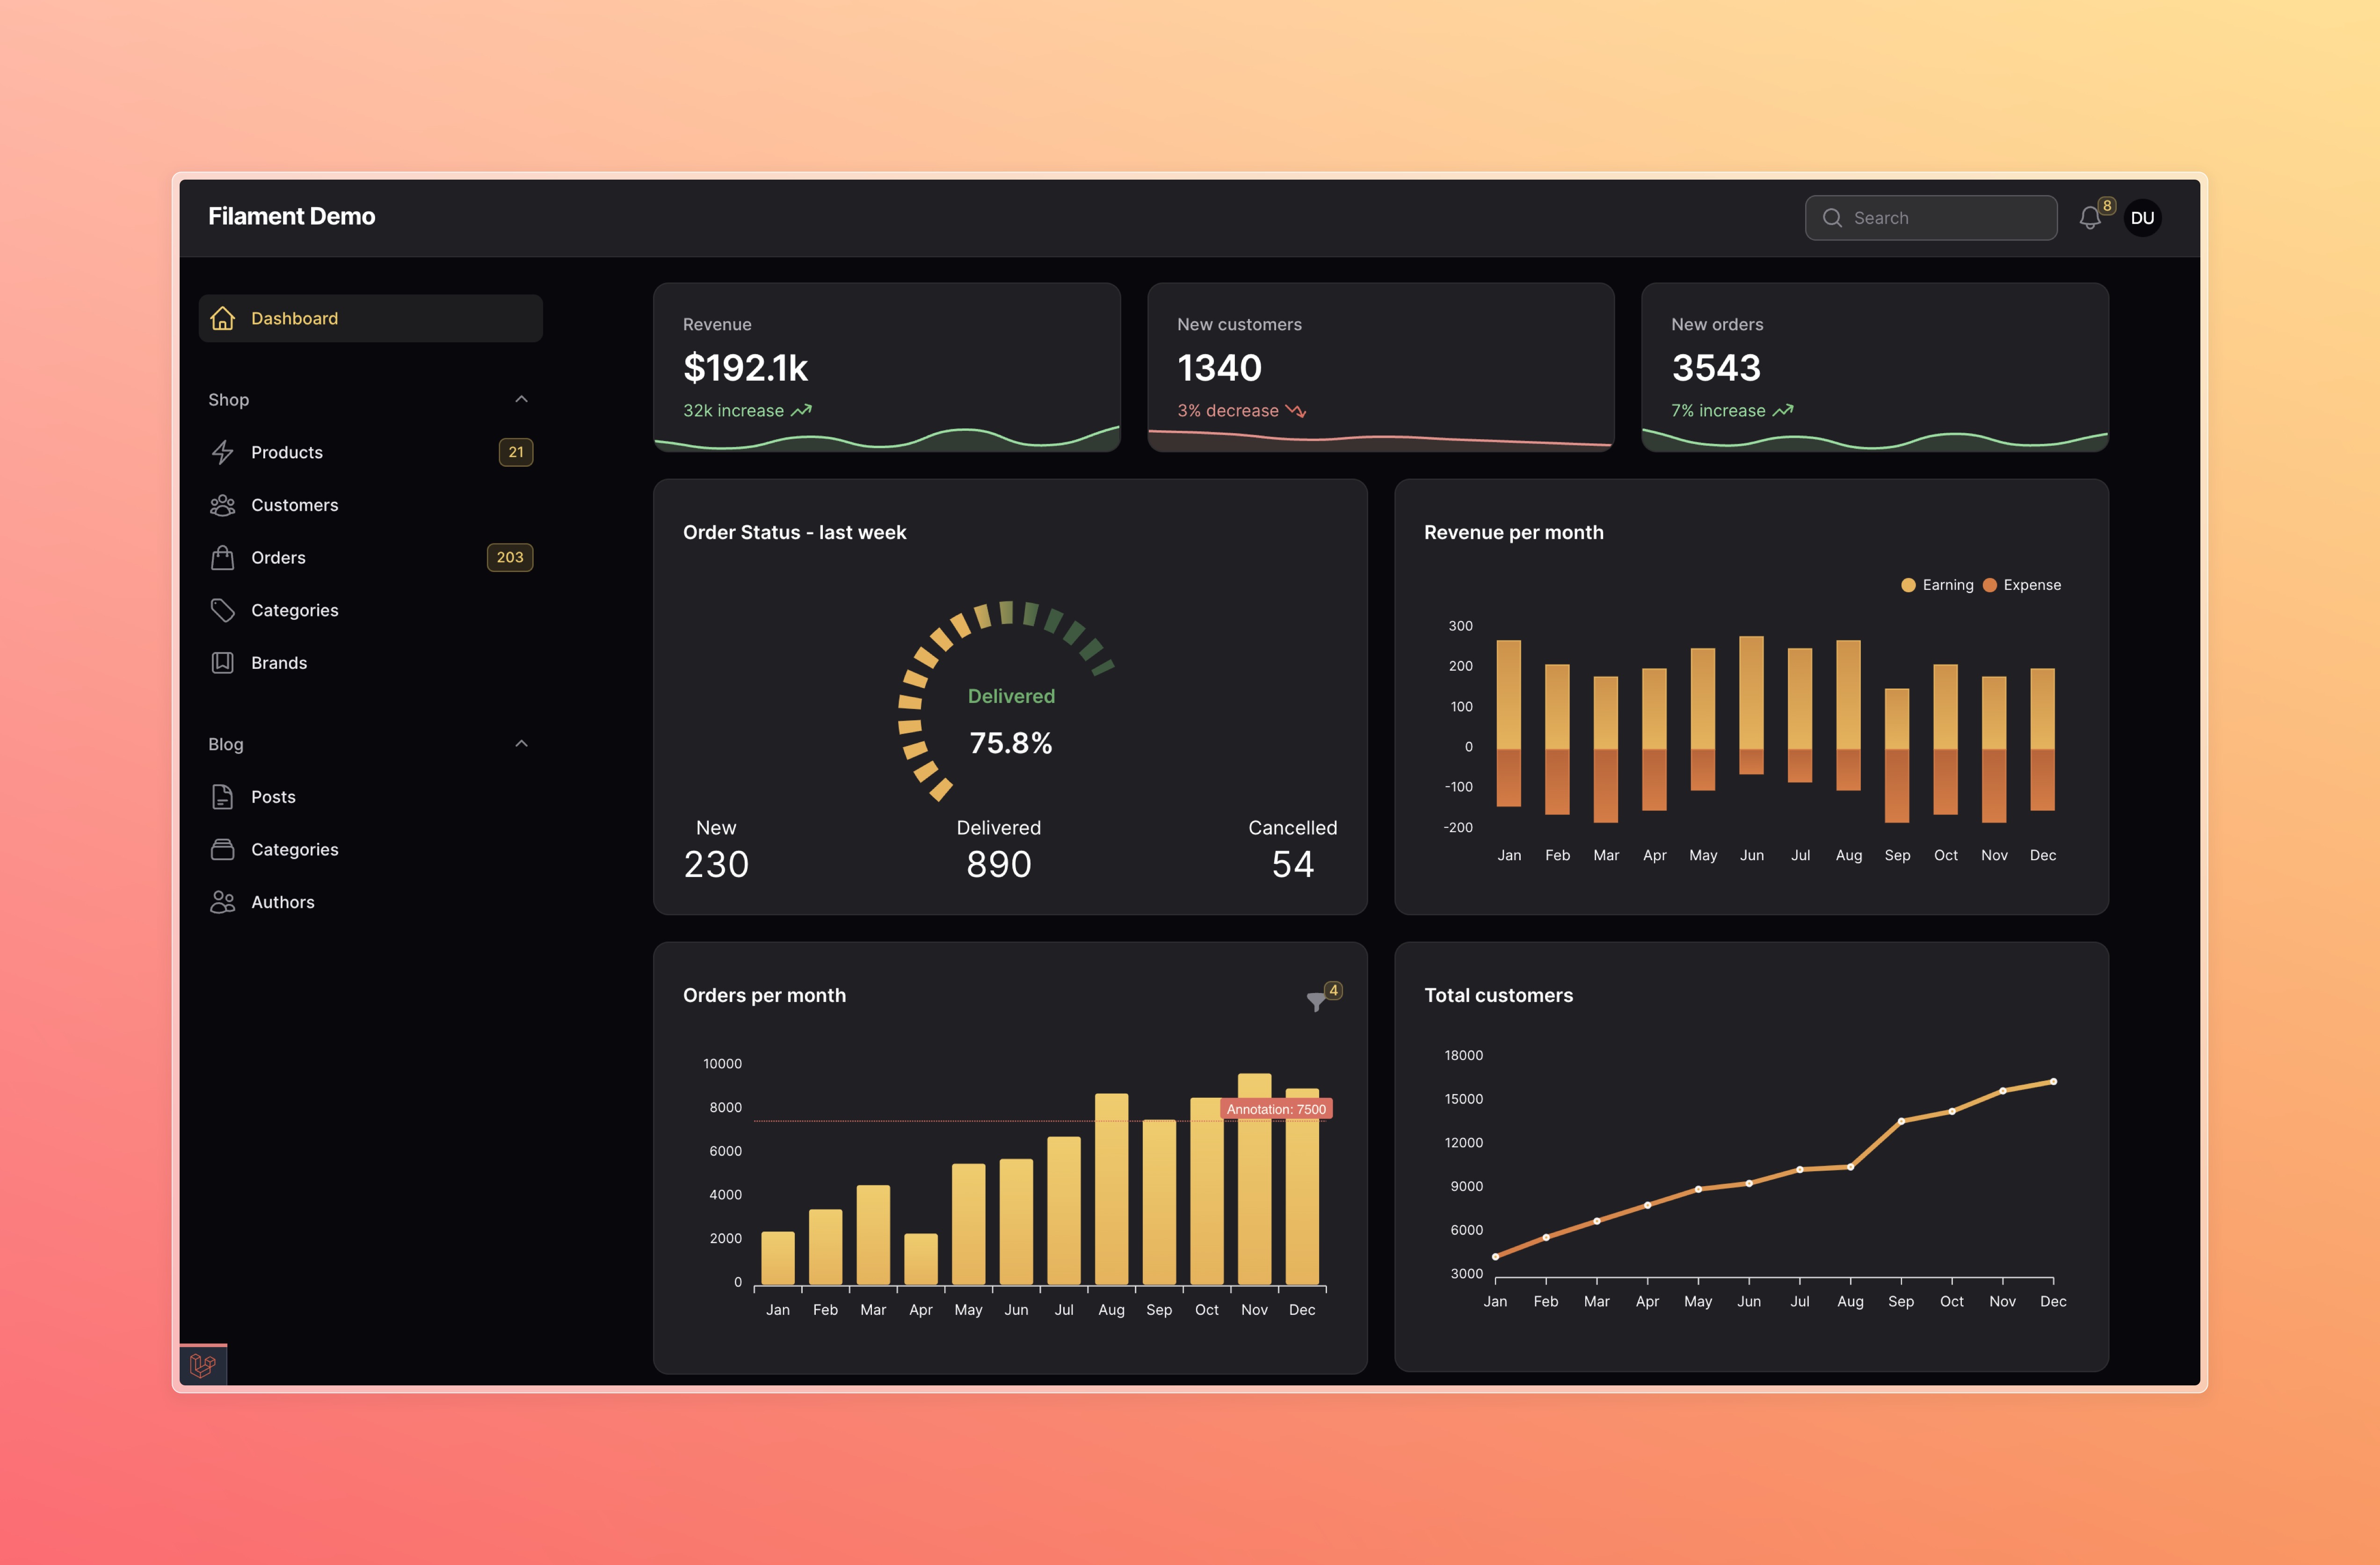
Apex Charts integration for Filament
Installation
You can install the package via composer:
composer require leandrocfe/filament-apex-charts:"^3.1"
Register the plugin for the Filament Panels you want to use:
use Leandrocfe\FilamentApexCharts\FilamentApexChartsPlugin;
public function panel(Panel $panel): Panel
{
    return $panel
        ->plugins([
            FilamentApexChartsPlugin::make()
        ]);
}
Filament V2 - if you are using Filament v2.x, you can use this section
Usage
Start by creating a widget with the command:
php artisan make:filament-apex-charts BlogPostsChart
Available chart samples
You may choose:
- Area
- Bar
- Boxplot
- Bubble
- Candlestick
- Column
- Donut
- Heatmap
- Line
- Mixed-LineAndColumn
- Pie
- PolarArea
- Radar
- Radialbar
- RangeArea
- Scatter
- TimelineRangeBars
- Treemap
- Funnel
You may also create an empty chart by selecting the Empty option.
This command will create the BlogPostsChart.php file in app\Filament\Widgets. Ex:
namespace App\Filament\Widgets;

use Leandrocfe\FilamentApexCharts\Widgets\ApexChartWidget;

class BlogPostsChart extends ApexChartWidget
{
    /**
     * Chart Id
     *
     * @var string
     */
    protected static ?string $chartId = 'blogPostsChart';

    /**
     * Widget Title
     *
     * @var string|null
     */
    protected static ?string $heading = 'BlogPostsChart';

    /**
     * Chart options (series, labels, types, size, animations...)
     * https://apexcharts.com/docs/options
     *
     * @return array
     */
    protected function getOptions(): array
    {
        return [
            'chart' => [
                'type' => 'bar',
                'height' => 300,
            ],
            'series' => [
                [
                    'name' => 'BlogPostsChart',
                    'data' => [7, 4, 6, 10, 14, 7, 5, 9, 10, 15, 13, 18],
                ],
            ],
            'xaxis' => [
                'categories' => ['Jan', 'Feb', 'Mar', 'Apr', 'May', 'Jun', 'Jul', 'Aug', 'Sep', 'Oct', 'Nov', 'Dec'],
                'labels' => [
                    'style' => [
                        'fontFamily' => 'inherit',
                        'fontWeight' => 600,
                    ],
                ],
            ],
            'yaxis' => [
                'labels' => [
                    'style' => [
                        'fontFamily' => 'inherit',
                    ],
                ],
            ],
            'colors' => ['#f59e0b'],
        ];
    }
}
Now, check out your new widget in the dashboard.
Available options
The getOptions() method is used to return an array of options based on Apex Charts Options. This structure is identical with the Apex Chart library, which Filament Apex Charts uses to render charts. You may use the Apex Chart documentation to fully understand the possibilities to return from getOptions().
Examples
Setting a widget title
You may set a widget title:
protected static ?string $heading = 'Blog Posts Chart';
Optionally, you can use the getHeading() method.
Setting a widget subheading
You may set a widget subheading:
protected static ?string $subheading = 'This is a subheading';
Optionally, you can use the getSubheading() method.
Setting a chart id
You may set a chart id:
protected static string $chartId = 'blogPostsChart';
Setting a widget height
You may set a widget height:
protected static ?int $contentHeight = 300; //px
Optionally, you can use the getContentHeight() method.
protected function getContentHeight(): ?int
{
    return 300;
}
Setting a widget footer
You may set a widget footer:
protected static ?string $footer = 'Lorem Ipsum is simply dummy text of the printing and typesetting industry.';
You can also use the getFooter() method:
Custom view:
use Illuminate\Contracts\Support\Htmlable;
use Illuminate\Contracts\View\View;

protected function getFooter(): null|string|Htmlable|View
{
    return view('custom-footer', ['text' => 'Lorem Ipsum is simply dummy text of the printing and typesetting industry.']);
}
<!--resources/views/custom-footer.blade.php-->
<div>
    <p class="text-danger-500">{{ $text }}</p>
</div>
Html string:
use Illuminate\Contracts\Support\Htmlable;
use Illuminate\Contracts\View\View;
protected function getFooter(): null|string|Htmlable|View
{
    return new HtmlString('<p class="text-danger-500">Lorem Ipsum is simply dummy text of the printing and typesetting industry.</p>');
}
Hiding header content
You can hide header content by NOT providing these
- $heading
- getHeading()
- $subheading
- getSubheading()
- getFormSchema()
- getOptions()
Filtering chart data
You can set up chart filters to change the data shown on chart. Commonly, this is used to change the time period that chart data is rendered for.
Filter forms
You may use components from the Form Builder to create custom filter forms:
use Filament\Forms\Components\DatePicker;
use Filament\Forms\Components\TextInput;

protected function getFormSchema(): array
{
    return [

        TextInput::make('title')
            ->default('My Chart'),

        DatePicker::make('date_start')
            ->default('2023-01-01'),

        DatePicker::make('date_end')
            ->default('2023-12-31')

    ];
}
The data from the custom filter form is available in the $this->filterFormData array. You can use the active filter form values within your getOptions() method:
protected function getOptions(): array
{
    $title = $this->filterFormData['title'];
    $dateStart = $this->filterFormData['date_start'];
    $dateEnd = $this->filterFormData['date_end'];

    return [
        //chart options
    ];
}
Also, if you want your chart data to update when the value of a filter changes, you have to combine reactive() with afterStateUpdated() :
use Filament\Forms\Components\DatePicker;
use Filament\Forms\Components\TextInput;

protected function getFormSchema(): array
{
    return [
        TextInput::make('title')
            ->default('My Chart')
            ->live()
            ->afterStateUpdated(function () {
                $this->updateChartOptions();
            }),
        ...
    ];
}
Changing the filter form width
You can change the filter form width by setting the $filterFormWidth property:
use Filament\Support\Enums\Width;
protected static Width|string $filterFormWidth = Width::Medium;
Single select
To set a default filter value, set the $filter property:
public ?string $filter = 'today';
Then, define the getFilters() method to return an array of values and labels for your filter:
protected function getFilters(): ?array
{
    return [
        'today' => 'Today',
        'week' => 'Last week',
        'month' => 'Last month',
        'year' => 'This year',
    ];
}
You can use the active filter value within your getOptions() method:
protected function getOptions(): array
{
    $activeFilter = $this->filter;

    return [
        //chart options
    ];
}
Live updating (polling)
By default, chart widgets refresh their data every 5 seconds.
To customize this, you may override the $pollingInterval property on the class to a new interval:
protected static ?string $pollingInterval = '10s';
Alternatively, you may disable polling altogether:
protected static ?string $pollingInterval = null;
Defer loading
This can be helpful when you have slow queries and you don't want to hold up the entire page load:
protected static bool $deferLoading = true;

protected function getOptions(): array
{
    //showing a loading indicator immediately after the page load
    if (!$this->readyToLoad) {
        return [];
    }

    //slow query
    sleep(2);

    return [
        //chart options
    ];
}
Loading indicator
You can change the loading indicator:
protected static ?string $loadingIndicator = 'Loading...';
You can also use the getLoadingIndicator() method:
use Illuminate\Contracts\View\View;
protected function getLoadingIndicator(): null|string|View
{
    return view('custom-loading-indicator');
}
<!--resources/views/custom-loading-indicator.blade.php-->
<div>
    <p class="text-danger-500">Loading...</p>
</div>
Dark mode
The dark mode is supported and enabled by default now.
Optionally, you can disable it:
protected static bool $darkMode = false;
You can also set the theme in the getOptions method:
protected function getOptions(): array
{
    return [
        'theme' => [
            'mode' => 'light' //dark
        ],
        'chart' => [
            'type' => 'bar',
            ...
        ],
        ...
    ];
}
Extra options and Formatters
You can use the extraJsOptions method to add additional options to the chart:
protected function extraJsOptions(): ?RawJs
{
    return RawJs::make(<<<'JS'
    {
        xaxis: {
            labels: {
                formatter: function (val, timestamp, opts) {
                    return val + '/24'
                }
            }
        },
        yaxis: {
            labels: {
                formatter: function (val, index) {
                    return '$' + val
                }
            }
        },
        tooltip: {
            x: {
                formatter: function (val) {
                    return val + '/24'
                }
            }
        },
        dataLabels: {
            enabled: true,
            formatter: function (val, opt) {
                return opt.w.globals.labels[opt.dataPointIndex] + ': $' + val
            },
            dropShadow: {
                enabled: true
            },
        }
    }
    JS);
}
Publishing views
Optionally, you can publish the views using:
php artisan vendor:publish --tag="filament-apex-charts-views"
Publishing translations
Optionally, you can publish the translations using:
php artisan vendor:publish --tag=filament-apex-charts-translations
Testing
composer test
Changelog
Please see CHANGELOG for more information on what has changed recently.
Contributing
Please see CONTRIBUTING for details.
Security Vulnerabilities
If you discover a security vulnerability within this package, please send an e-mail to leandrocfe@gmail.com.
Credits
License
The MIT License (MIT). Please see License File for more information.
attendlabs/filament-apex-charts 适用场景与选型建议
attendlabs/filament-apex-charts 是一款 基于 PHP 开发的 Composer 扩展包,目前已累计 7 次下载、GitHub Stars 达 0, 最近一次更新时间为 2025 年 07 月 22 日, 在 PHP 生态内属于活跃度较高的组件。
它主要适用于以下技术方向: 「laravel」 「apexcharts」 「leandrocfe」 「filament-apex-charts」 等业务场景。在实际项目中,围绕这些方向常见需要落地的问题包括:接口对接、性能调优、并发安全、与既有框架(Laravel / ThinkPHP / Yii / Webman 等)的兼容适配,以及生产环境的日志埋点与稳定性保障。
我们在过去多个企业项目中使用过 attendlabs/filament-apex-charts 或与其功能相近的方案,如果你在选型或落地过程中遇到问题,例如 版本兼容、二次改造、私有化封装、与内部系统对接、生产 BUG 排查,欢迎联系我们协助评估。
基于 attendlabs/filament-apex-charts 在你已有业务上做功能扩展、字段裁剪、UI 适配、与内部账号 / 权限 / 日志系统的深度对接。
线上偶发问题、内存泄漏、慢查询、并发异常等排查修复;针对高流量场景做缓存、队列、索引层面的调优。
承接完整的项目从需求 → 设计 → 开发 → 上线 → 长期运维;也可按月提供技术保姆服务。
与 attendlabs/filament-apex-charts 相关的其它包
同方向 / 同关键字的高下载量 PHP Composer 包推荐,方便对比选型:
Apex Charts integration for Filament PHP.
Brazilian pt-BR form fields.
Yii2 charts widget - wrapper for the ApexCharts.js
A Laravel Nova card to show Treemap charts
Package to provide easy api to build apex charts on Laravel
Package to provide easy api to build apex charts on Laravel
统计信息
- 总下载量: 7
- 月度下载量: 0
- 日度下载量: 0
- 收藏数: 0
- 点击次数: 27
- 依赖项目数: 0
- 推荐数: 0
其他信息
- 授权协议: MIT
- 更新时间: 2025-07-22