moonshine/apexcharts
Composer 安装命令:
composer require moonshine/apexcharts
包简介
Apexcharts for MoonShine
README 文档
README
Note
This package adds ApexCharts.js components to the MoonShine Laravel admin panel.
Compatibility
| MoonShine | Moonshine ApexCharts | Currently supported |
|---|---|---|
| >= v3.0 | >= v1.0.0 | no |
| >= v3.0 | >= v3.0.0 | yes |
Installation
Install the package via Composer:
composer require moonshine/apexcharts
Publish the assets:
php artisan vendor:publish --tag=moonshine-apexcharts-assets --force
Optional: Publish the configuration file to customize default settings:
php artisan vendor:publish --tag=moonshine-apexcharts-config
Available Chart Types
- Line Chart - Linear, area, and column charts for time-series data with full typing support
- Donut Chart - Circular charts for categorical data
- Sparkline Chart - Minimalist charts for KPI cards with value and change indicators
- Raw Chart - Direct access to ApexCharts configuration for maximum flexibility
Quick Start
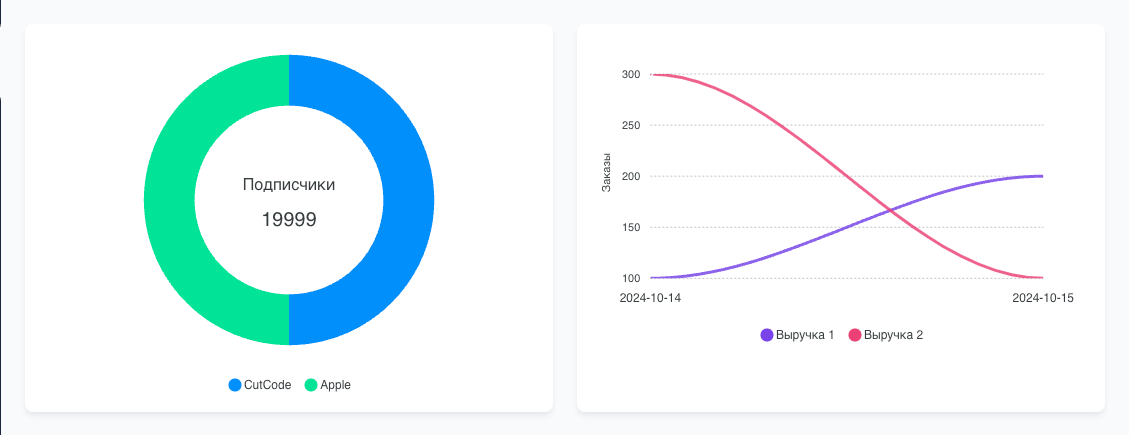
Line Chart
use MoonShine\Apexcharts\Components\LineChartMetric;
use MoonShine\Apexcharts\Support\SeriesItem;

LineChartMetric::make('Заказы')
    ->series([
        SeriesItem::make('Выручка 1', [
            now()->format('Y-m-d') => 100,
            now()->addDay()->format('Y-m-d') => 200,
            now()->addDays(2)->format('Y-m-d') => 500,
            now()->addDays(3)->format('Y-m-d') => 700,
        ])->color('#EC4176'),
        SeriesItem::make('Выручка 2', [
            now()->format('Y-m-d') => 300,
            now()->addDay()->format('Y-m-d') => 400,
            now()->addDays(2)->format('Y-m-d') => 300,
            now()->addDays(3)->format('Y-m-d') => 800,
        ])->color('#85737E'),
        SeriesItem::make('Выручка 3', [
            now()->format('Y-m-d') => 400,
            now()->addDay()->format('Y-m-d') => 500,
            now()->addDays(2)->format('Y-m-d') => 400,
            now()->addDays(3)->format('Y-m-d') => 600,
        ])->color('#1e96fc'),
    ]),

LineChartMetric::make('Заказы')
    ->series([
        SeriesItem::make('Выручка 1', [
            now()->format('Y-m-d') => 100,
            now()->addDay()->format('Y-m-d') => 200,
            now()->addDays(2)->format('Y-m-d') => 500,
            now()->addDays(3)->format('Y-m-d') => 700,
        ])->line(),
        SeriesItem::make('Выручка 2', [
            now()->format('Y-m-d') => 300,
            now()->addDay()->format('Y-m-d') => 400,
            now()->addDays(2)->format('Y-m-d') => 300,
            now()->addDays(3)->format('Y-m-d') => 800,
        ])->area(),
        SeriesItem::make('Выручка 3', [
            now()->format('Y-m-d') => 400,
            now()->addDay()->format('Y-m-d') => 500,
            now()->addDays(2)->format('Y-m-d') => 400,
            now()->addDays(3)->format('Y-m-d') => 600,
        ])->column(),
    ])
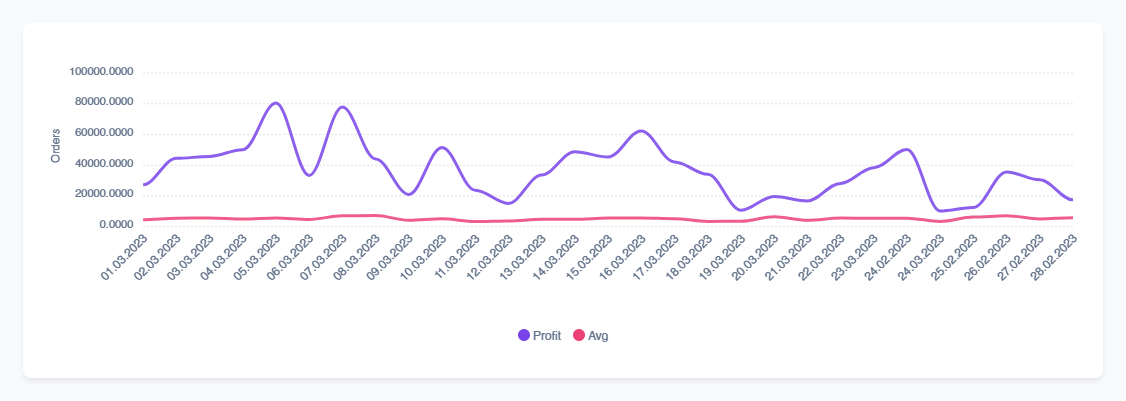
Donut Chart
use MoonShine\Apexcharts\Components\DonutChartMetric;

DonutChartMetric::make('Traffic Sources')
    ->values([
        'Direct' => 3250,
        'Organic' => 2100,
        'Social' => 1850,
        'Referral' => 1200,
    ]);
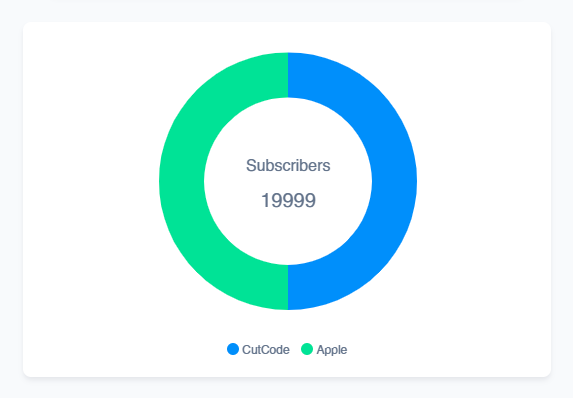
Sparkline Chart
Minimalist area charts perfect for KPI cards and dashboard widgets:
use MoonShine\Apexcharts\Components\SparklineChartMetric;

// Basic sparkline with value and change indicator
SparklineChartMetric::make('Revenue')
    ->values([30, 40, 35, 50, 49, 60, 70, 91, 125])
    ->value('192.10k', prefix: '$')
    ->change(32, suffix: 'k')
    ->colors(['#10b981'])
With decrease indicator (negative change):
SparklineChartMetric::make('Expenses')
    ->values([100, 95, 90, 85, 80, 75])
    ->value('45.5k', prefix: '$')
    ->change(-12, suffix: 'k')
    ->colors(['#ef4444'])
Custom change text (localization):
SparklineChartMetric::make('Users')
    ->values([10, 20, 30, 40, 50])
    ->value('1,234')
    ->change(156)
    ->changeText('growth', 'decline')
Straight line instead of smooth curve:
SparklineChartMetric::make('Orders')
    ->values([5, 8, 12, 15, 20])
    ->value(847)
    ->change(23, suffix: '%')
    ->straight()
Without gradient fill:
SparklineChartMetric::make('Visits')
    ->values([50, 60, 55, 70, 65])
    ->value('12.5k')
    ->withoutGradient()
    ->colors(['#3b82f6'])
Minimal sparkline (no value display):
SparklineChartMetric::make('Trend')
    ->values([1, 3, 2, 4, 3, 5, 4, 6])
    ->colors(['#8b5cf6'])
    ->height(40)
With icon and custom icon color:
use MoonShine\Support\Enums\Color;

SparklineChartMetric::make('Revenue')
    ->icon('heroicons.currency-dollar')
    ->iconColor(Color::SUCCESS)
    ->values([30, 40, 35, 50, 49, 60, 70])
    ->value('192.10k', prefix: '$')
    ->change(32, suffix: 'k')
    ->colors(['#10b981'])
Available icon colors: Color::PRIMARY, Color::SECONDARY, Color::SUCCESS, Color::WARNING, Color::ERROR, Color::INFO
Raw Chart
For custom chart types or advanced configurations:
use MoonShine\Apexcharts\Components\RawChartMetric;

RawChartMetric::make('Interactive Radar Chart')
    ->config([
        'chart' => [
            'type' => 'radar',
            'height' => 350,
        ],
        'series' => [
            [
                'name' => 'Current Year',
                'data' => [20, 90, 45, 75, 60],
            ],
        ],
        'xaxis' => [
            'categories' => ['Q1', 'Q2', 'Q3', 'Q4', 'Q5'],
        ],
    ])
    ->jsChartEvents(<<<'JS'
        {
            click: (chartContext, options) => {
                console.log('Chart clicked:', options);
            }
        }
    JS);
Theme Configuration
The theme() method allows you to configure chart appearance with color palettes and monochrome options:
->theme(
    int|string|null $palette = null,      // Color palette (1-10) or palette name
    bool $monochromeEnabled = false,      // Enable monochrome colors
    bool $monochromeLight = false,        // Monochrome shade direction
    ?string $monochromeColor = null,      // Custom monochrome base color
    float $monochromeShadeIntensity = 0.65 // Monochrome shade intensity (0-1)
)
Theme Examples
Simple palette:
->theme(6) // Use predefined color palette
Monochrome with custom color:
->theme(
    monochromeEnabled: true,
    monochromeColor: '#FF6384',
    monochromeShadeIntensity: 0.5
)
API Reference
Common Methods
Available for all chart types:
->withoutWrapper()- Remove box wrapper for custom layouts->columnSpan(int $span)- Number of grid columns (1-12)->colors(array $colors)- Override palette with custom colors->theme(...)- Configure theme with palette and options->height(int $height)- Chart height in pixels->icon(string $icon)- Set icon (e.g.,'heroicons.chart-bar')->iconColor(Color $color)- Set icon color usingMoonShine\Support\Enums\Color->jsChartEvents(string $js)- JavaScript event handlers
LineChartMetric
->series(array|SeriesItem $series)- Add series->withoutSortKeys()- Preserve original key order
SeriesItem::make(string $name, array $data)
    ->line()                // Line chart type
    ->area()                // Area chart type
    ->column()              // Column chart type
    ->color('#FF5722')      // Custom color
    ->name('New Name')      // Change display name
    ->data([...])           // Update data
DonutChartMetric
->values(array $values)- Chart data (key => value)->decimals(int $decimals)- Decimal places (0-100)
SparklineChartMetric
Data methods:
->values(array $values)- Array of numeric values for the chart
Value display:
->value(string|int|float $value, ?string $prefix, ?string $suffix)- Main value to display->change(string|int|float $value, ?string $prefix, ?string $suffix)- Change indicator (positive = green, negative = red)->changeText(string $increase, string $decrease)- Custom text for increase/decrease labels->withoutChangeText()- Hide increase/decrease text, show only value and icon
Chart appearance:
->curve(string $curve)- Curve type:'smooth','straight','stepline','monotoneCubic'->straight()- Shortcut for->curve('straight')->gradient(bool $enabled, float $opacityFrom, float $opacityTo)- Configure gradient fill->withoutGradient()- Disable gradient fill (line only)->strokeWidth(int $width)- Line thickness (default: 2)->withoutTooltip()- Disable hover tooltip
RawChartMetric
->config(array $config)- Full ApexCharts configuration
Events
Add interactivity with JavaScript events:
RawChartMetric::make('Interactive Chart')
    ->jsChartEvents(<<<'JS'
        {
            dataPointSelection: (event, chartContext, config) => {
                console.log('Selected:', config.w.config.labels[config.dataPointIndex]);
            },
            click: (chartContext, options) => {
                // Handle chart click
            }
        }
    JS);
Grid Layout
Charts can be arranged in a responsive grid using MoonShine's Grid component and the columnSpan() method.
Basic Grid Usage
use MoonShine\UI\Components\Layout\Grid;
use MoonShine\Apexcharts\Components\DonutChartMetric;
use MoonShine\Apexcharts\Components\LineChartMetric;
use MoonShine\Apexcharts\Components\SparklineChartMetric;
use MoonShine\Apexcharts\Components\RawChartMetric;

Grid::make([
    DonutChartMetric::make('Traffic Sources')
        ->values([
            'Direct' => 3250,
            'Organic' => 2100,
            'Social' => 1850,
            'Referral' => 1200,
        ])
        ->theme(2)
        ->columnSpan(4),

    DonutChartMetric::make('Sales by Category')
        ->values([
            'Electronics' => 45320,
            'Clothing' => 32150,
            'Food' => 28900,
            'Books' => 12300,
        ])
        ->theme(7)
        ->columnSpan(4),

    DonutChartMetric::make('User Activity')
        ->values([
            'Active' => 1250,
            'Inactive' => 320,
            'New' => 180,
            'Old' => 250,
        ])
        ->theme(1)
        ->columnSpan(4),
])
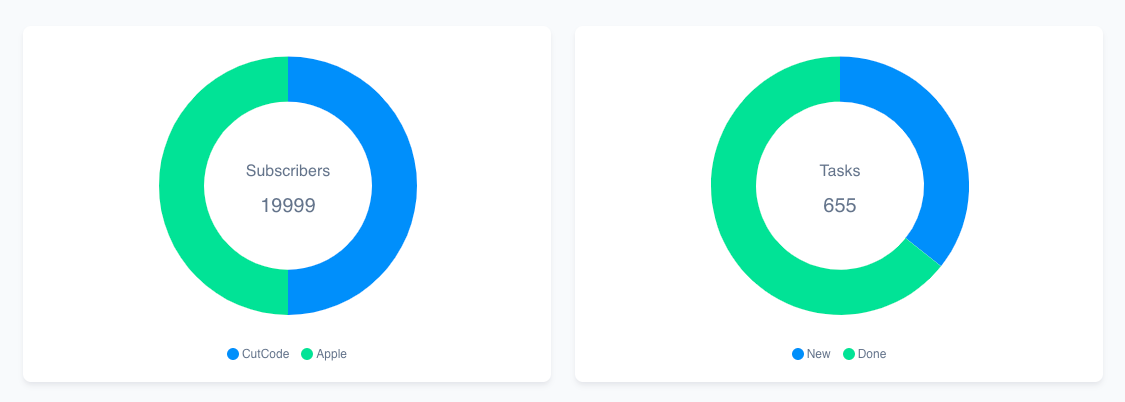
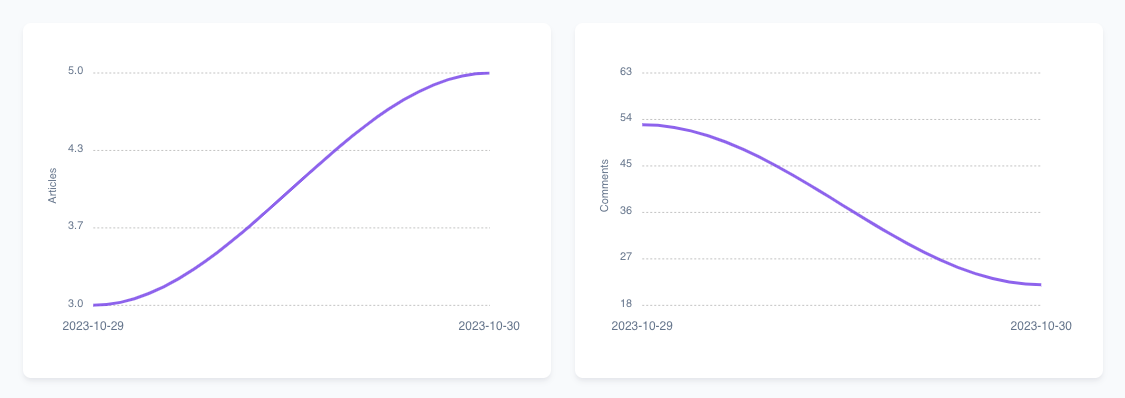
Sparkline KPI Dashboard
Grid::make([
    SparklineChartMetric::make('Revenue')
        ->values([30, 40, 35, 50, 49, 60, 70, 91, 125])
        ->value('192.10k', prefix: '$')
        ->change(32, suffix: 'k')
        ->colors(['#10b981'])
        ->columnSpan(3),

    SparklineChartMetric::make('Orders')
        ->values([120, 132, 101, 134, 90, 230, 210])
        ->value('1,847')
        ->change(12.5, suffix: '%')
        ->colors(['#3b82f6'])
        ->columnSpan(3),

    SparklineChartMetric::make('Customers')
        ->values([220, 182, 191, 234, 290, 330, 310])
        ->value('9,432')
        ->change(8.2, suffix: '%')
        ->colors(['#8b5cf6'])
        ->columnSpan(3),

    SparklineChartMetric::make('Refunds')
        ->values([150, 232, 201, 154, 190, 130, 110])
        ->value('2.4k', prefix: '$')
        ->change(-18, suffix: '%')
        ->colors(['#ef4444'])
        ->columnSpan(3),
])
License
This package is open-sourced software licensed under the MIT license.
moonshine/apexcharts 适用场景与选型建议
moonshine/apexcharts 是一款 基于 PHP 开发的 Composer 扩展包,目前已累计 21.72k 次下载、GitHub Stars 达 3, 最近一次更新时间为 2024 年 10 月 20 日, 在 PHP 生态内属于活跃度较高的组件。
它主要适用于以下技术方向: 「charts」 「line charts」 「apexcharts」 「moonshine」 「donut charts」 等业务场景。在实际项目中,围绕这些方向常见需要落地的问题包括:接口对接、性能调优、并发安全、与既有框架(Laravel / ThinkPHP / Yii / Webman 等)的兼容适配,以及生产环境的日志埋点与稳定性保障。
我们在过去多个企业项目中使用过 moonshine/apexcharts 或与其功能相近的方案,如果你在选型或落地过程中遇到问题,例如 版本兼容、二次改造、私有化封装、与内部系统对接、生产 BUG 排查,欢迎联系我们协助评估。
基于 moonshine/apexcharts 在你已有业务上做功能扩展、字段裁剪、UI 适配、与内部账号 / 权限 / 日志系统的深度对接。
线上偶发问题、内存泄漏、慢查询、并发异常等排查修复;针对高流量场景做缓存、队列、索引层面的调优。
承接完整的项目从需求 → 设计 → 开发 → 上线 → 长期运维;也可按月提供技术保姆服务。
与 moonshine/apexcharts 相关的其它包
同方向 / 同关键字的高下载量 PHP Composer 包推荐,方便对比选型:
Yii2 charts widget - wrapper for the ApexCharts.js
The "View Counter" bundle
A Versatile and Expandable jQuery Plotting Plugin
PHP library for c3js
Draw charts with a simple API on Laravel
A Laravel Nova card to show Treemap charts
统计信息
- 总下载量: 21.72k
- 月度下载量: 0
- 日度下载量: 0
- 收藏数: 3
- 点击次数: 21
- 依赖项目数: 1
- 推荐数: 0
其他信息
- 授权协议: MIT
- 更新时间: 2024-10-20